Goodman diagram
The Goodman diagram within Spring Calculator Professional allows you to estimate the cycle life to failure of your spring.
Interpreting the graph
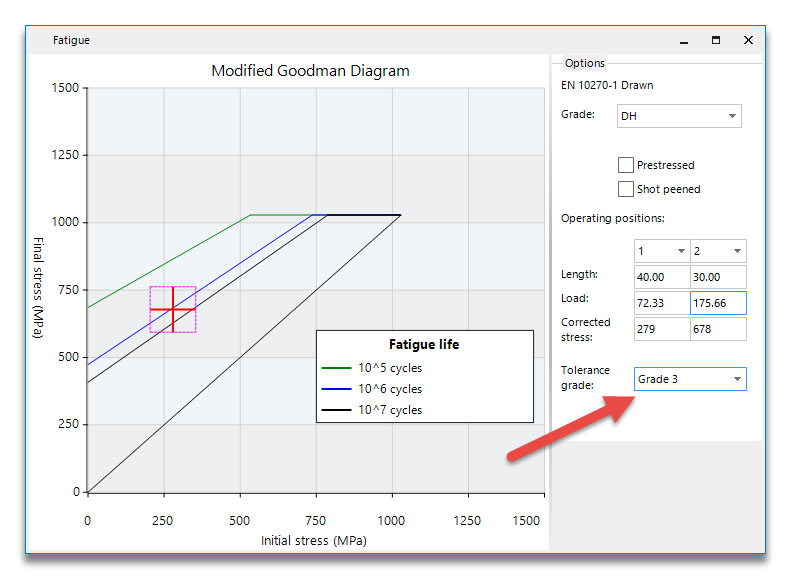
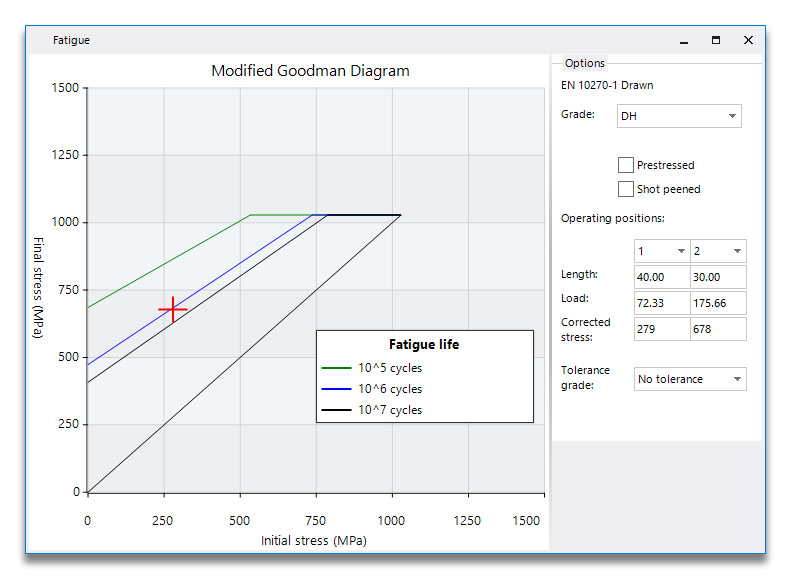
The red cross on the graph represents the two operating positions the spring is cycling between - if you have more than two working positions you can choose on the right hand side which the spring is cycling between. To achieve a certain life, the cross must fall below the line representing that life. So in the diagram above, the spring is predicted to just achieve 10^6 (1,000,000) cycles.
Graph options
The performance will depend on the grade of wire (for both its tensile strength and surface quality), so changing this dropdown will alter the prediction.
Ticking either the prestressed or shot-peened box will improve the cycle life prediction. Shot peening usually has a very beneficial effect on fatigue life. Prestressing provides a residual compressive stress that also benefits fatigue life, although not usually as greatly.
Note: the prestressed option will not be available if the solid stress is not high enough to physically allow prestressing.
It is important to take into account tolerance. If you have a tolerance on the loads, this will affect the permissible stress as well, and this is represented by a box on the graph - anywhere within the box would meet the load tolerance. Below you can see the effect of selecting Grade 3 tolerance. In this example you could achieve a little over 100,000 cycles or well over 10 million, and still be within tolerance - it is a somewhat extreme example because this is a very generous tolerance grade, but the principle applies.