Stress Data
The Stress Data grid allows you to quickly see whether the spring is safe operating at various lengths. It can be a little confusing at first, so we will explain in stages.
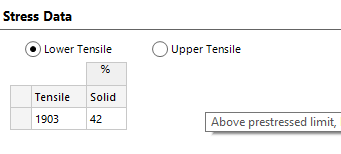
The rows in the grid represent the various grades of the currently chosen material. Some materials have a single grade, for example ASTM A228 (sometimes a single grade will have a description label, sometimes - as here - it does not):

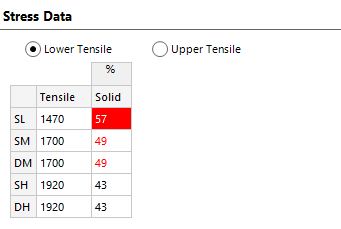
While some have up to five grades, such as EN 10270-1:

The Tensile column represents the UTS (ultimate tensile strength) of the wire, and so this value will change as you alter the wire diameter. You can see in the example above that SH and DH are the highest strength grades of this wire (the L, M and H letters mean low, medium and high strength, whereas S and D denote static and dynamic duty).
All other columns represent the stress as a percentage of the UTS, which is how allowable stress levels are generally defined in springs. So in the example above, the calculated stress at the solid position is 57% of UTS for the SL grade, 49% for the SM or DM grade, and 43% for the SH or DH grade.
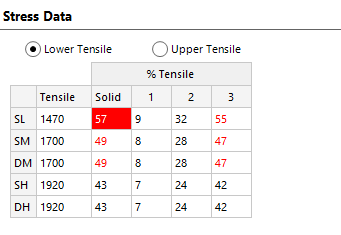
As you enter working positions, additional columns will appear for each one:

In this example, if we were considering the DH grade, we could see that the stress was 43% at solid, 9% at the first working position, 24% at the second and 42% at the third.
The colours designate the stress levels. Black text means that the spring is unprestressed at this position. Red text means a prestressed position, and a red background means overstressed. Read more about the theory of stress limits.