Data reporting
The data reporting window allows you to query your databases of spring designs by a variety of parameters. You can export a list of the designs, plot trends of the number of designs matching certain criteria over time, and compare the frequency of different values.
Listing and filtering data
The initial window view is as below. The dropdowns in the top row allow you to change the data you are displaying, as well as filtering by typing in the row below.
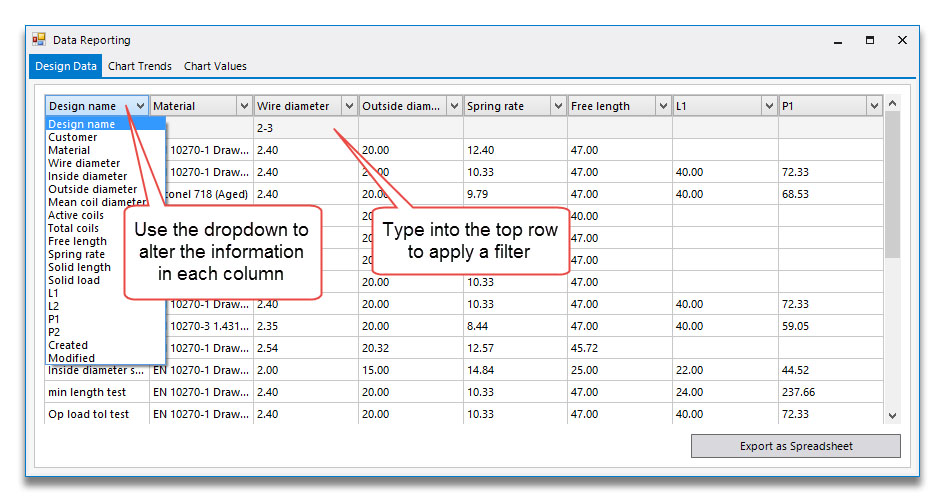
The filters can be text search strings or numerical. Some examples:
- inside tol in the design name field will search for any design that contains both the words "inside" and "tol" (does not have to be whole word matches).
- < 5 in the wire diameter field will list all designs with a wire size less than 5 mm.
- <= 5 will also include those with a wire size of 5 mm.
- 2-3 will list designs with a wire size between 2 and 3 mm (including those values)
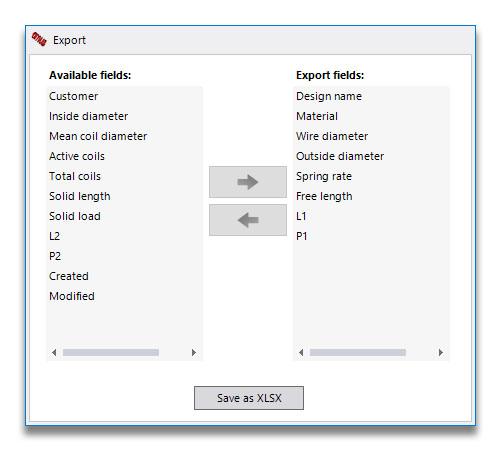
Clicking on "Export as Spreadsheet" allows you to select which columns are of interest (including those not already showing), and save to an Excel file.
Charting trends
The Chart Trends tab at the top of the window shows you how the number of designs (matching the filter criteria on the first tab) varies over time. The default is all designs, but you can also add chart series with additional filters. For example, the overall filter on the Design Data tab might limit the input data to a particular year, and you might choose to add column series for all designs, and those of several other materials.
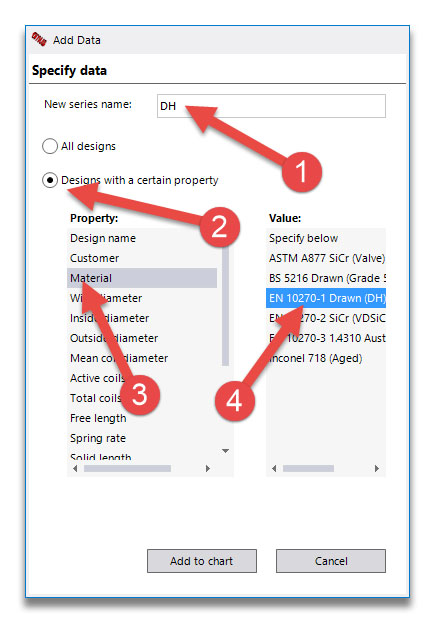
In the example below, we have given the series a name of DH (1), chosen to filter the data (2), selected to filter by material (3) and picked a particular value (4):
This is the resulting chart:
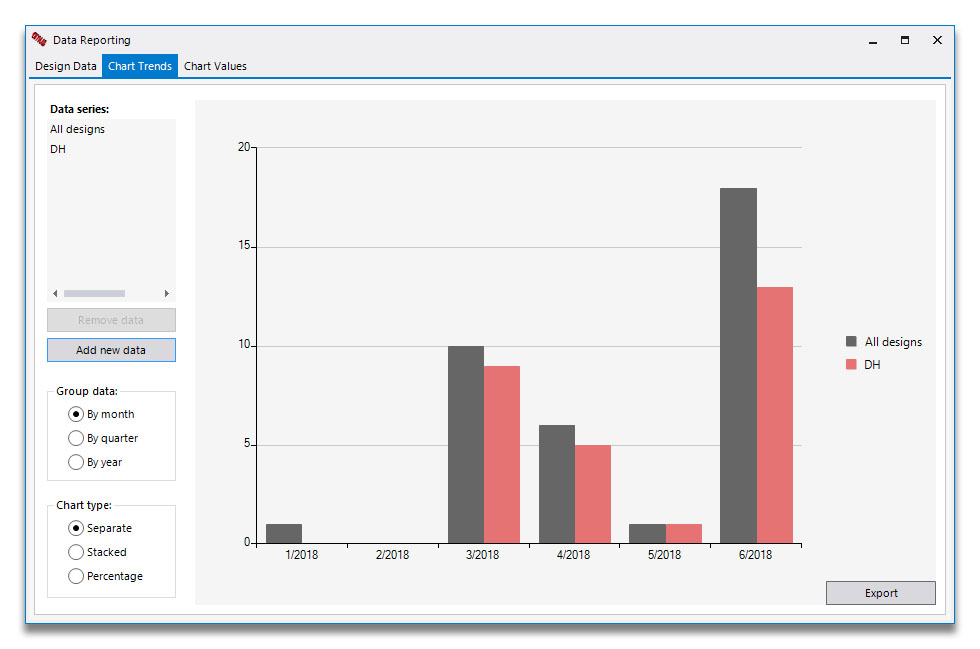
By adding custom ranges you can build up more complex graphs, for example you could specify three wire diameter series, of <2, 2-5 and >5, and plot these as a stacked graph showing quarterly trends.
Charting frequencies
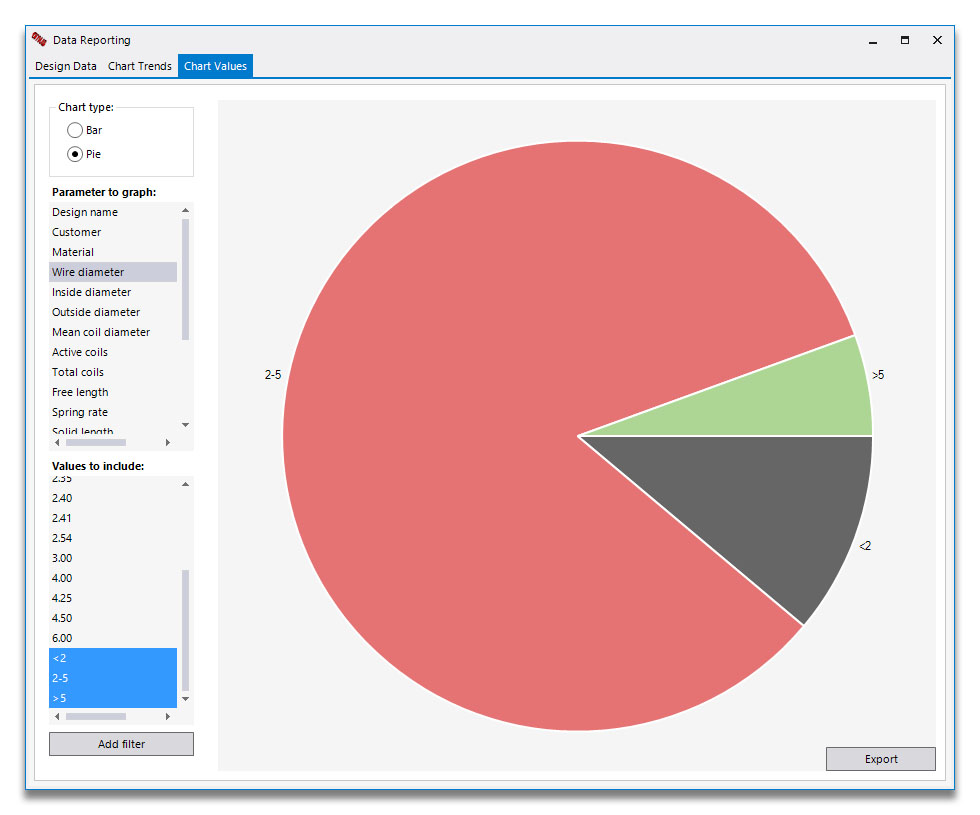
The third tab in this window is Chart Values. Again this applies any filters on the Design Data tab, and allows you to compare various values of a particular property. So for example, you could choose to see which are the most popular materials you use, or see which wire sizes. Each discrete value is shown, so you may want to enter ranges (click Add Filter) as described above:
